BARRYBARRY

Features

See every pipeline, end to end.

One picture of where your data comes from, where it goes, and whether it’s healthy.

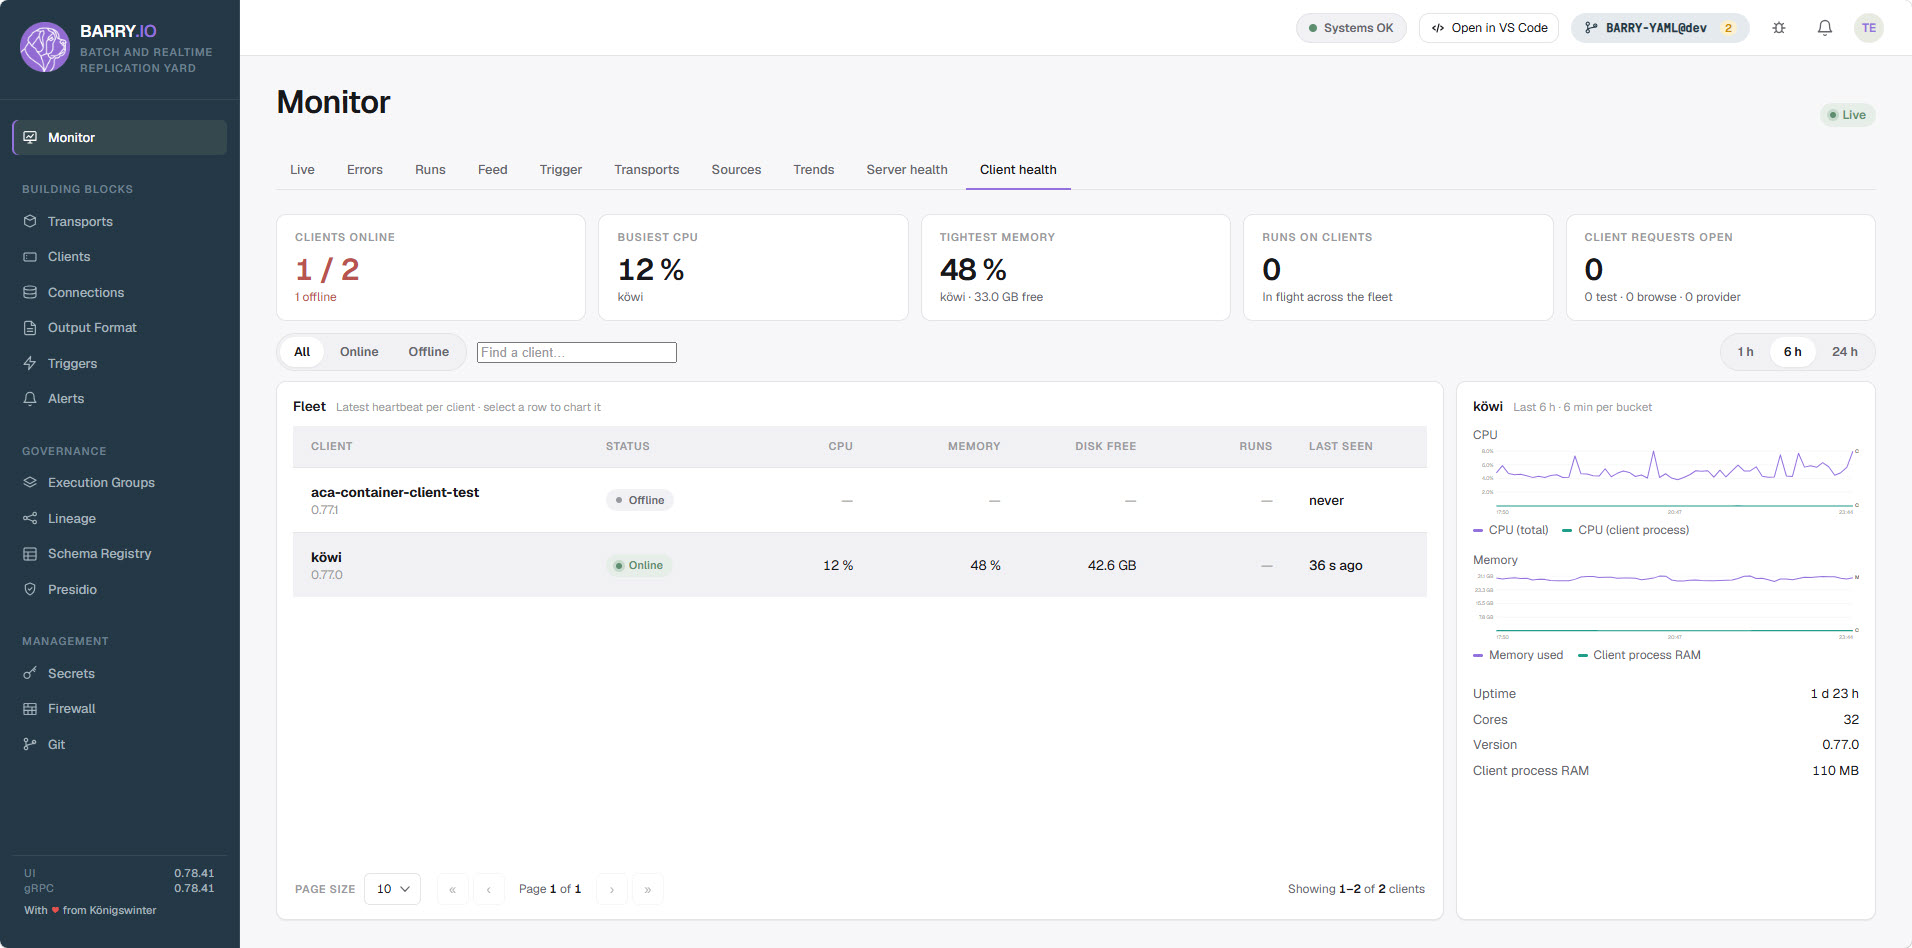
Two questions come up constantly: is this pipeline healthy, and where did this number come from? BARRY answers both in one place. The monitor brings every run together – status, duration, throughput, row counts and how fresh each dataset is – so a problem is visible before someone downstream notices it. The lineage graph then shows how sources, transports and destinations connect, down to the individual column, built from the pipelines you already run rather than maintained by hand. Schema changes are recorded per run, so you can trace a surprising value back to the moment its column changed. If your organisation already has a catalog, the same lineage exports through OpenLineage.

  • Live run status, throughput and freshness
  • One graph of sources, transports and targets
  • Column-level schema-change history
  • OpenLineage export to Marquez, DataHub or your catalog
  • Alerts to Teams, Slack, email and webhooks
Trends
Throughput, duration and failure trends over time.
Freshness
Know at a glance which datasets are stale.
Alerts
Get told before someone else notices.

Ready to unlock your data?

See how BARRY brings your on-premises data to the cloud — safely, and on your terms.